Successful businesses are driven by data. By analyzing key metrics, decision-makers can easily see what works, what doesn’t, and what they need to change to thrive in the future.
Traditional data management systems require hours or even days of manual organization, but technology allows for a more automated, real-time approach to analytics. With custom data visualization and reporting programs, you can take full advantage of your performance indicators and quickly address potential problems.
What is data visualization?
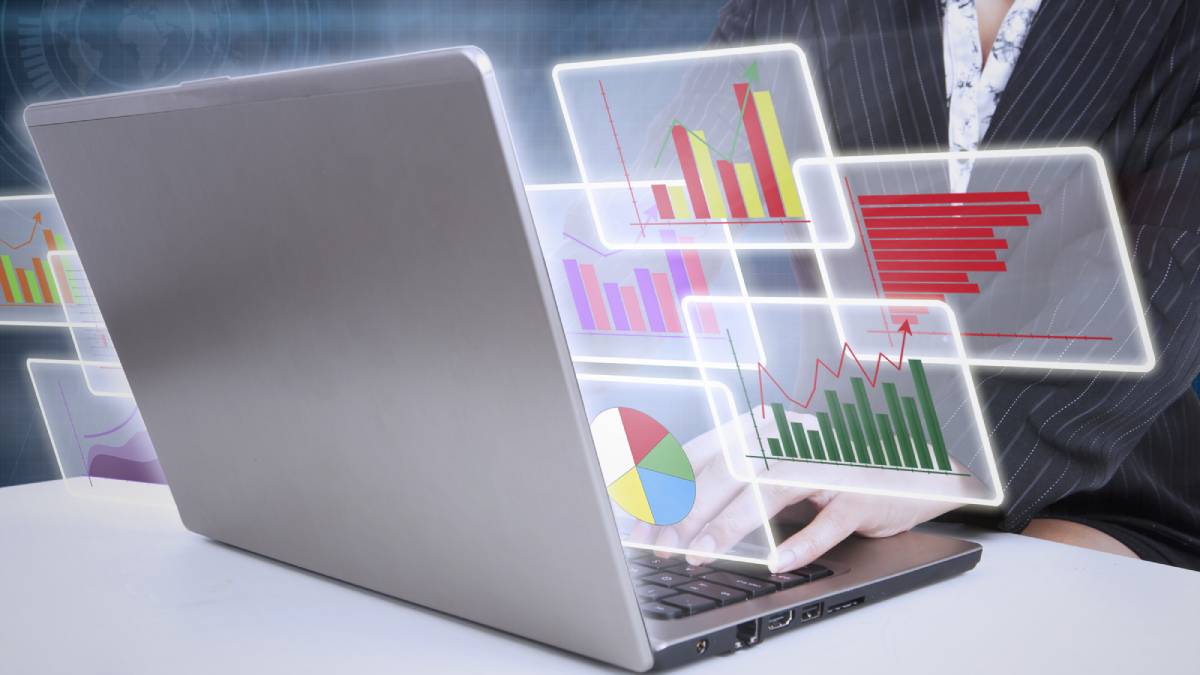
Data visualization involves converting data into graphs, charts, and other visual aids that provide a snapshot of key performance indicators (KPIs). It converts numbers into patterns that our eyes can swiftly analyze, sort and digest.
Think of how you feel reading a spreadsheet versus reading a line graph. With a spreadsheet, it may take a while to notice areas for improvement. With a line graph, you can pinpoint outliers within seconds and create a corresponding plan of action. Both options provide the same data, but one is more actionable than the other.
Why custom reporting and analytics is crucial for business performance
Data visualization is only as effective as the data it contains. Therefore it is important for each business to have custom visualization, reporting, and analytics tailored to its specific needs. At LSG Solutions, we provide KPI-focused dashboards that offer vital information at a glance.
The metrics that matter to your business may not be the same as your competitors. Our enterprise analytics solutions are personalized, flexible, and adjust to fit your growing goals.
Data visualization case study: OKDHS
To emphasize the value of data visualization, let’s look at the recent work LSG Solutions did for the Oklahoma Department of Human Services. We transitioned OKDHS from an outdated AS/400 platform to PeopleSoft, allowing them to access in-depth financial information with just the click of a button.
The COVID-19 pandemic created a slew of unprecedented budgeting constraints for the department, and their old system was not able to showcase the data they needed when they needed it. We evaluated their goals, created a plan for reporting and data visualization, and then implemented a multi-step transition that they now use for day-to-day budgeting decisions. The organization can now make rapid decisions because their new system mines and organizes critical data for them.
No tags for this post.


Leave A Comment